Describing a Distribution
-Shape
The shape of a distribution can be described as symmetrical, right skewed, or left skewed. A graph is symmetrical when each side of the center is a mirror image or close to a mirror image of the other. A graph is skewed when one tail extends farther from the center than the other. If one tail extends farther right than the other extends left, it is right skewed. If one tail extends farther left than the other extends right, it is left skewed.
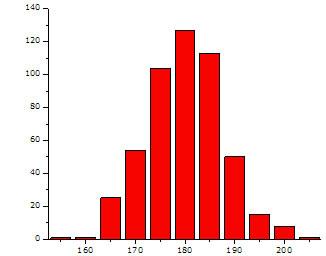
Symmetrical Distribution
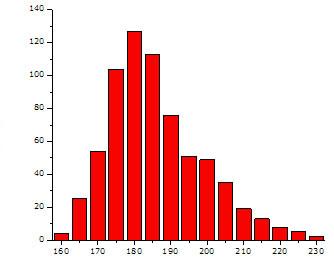
Right Skewed Distribution

Left Skewed Distribution
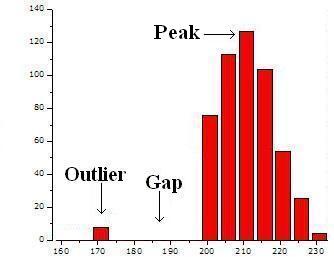
-Gaps, outliers, and peaks
Some distributions contain gaps and outliers. Outliers are pieces of data that are very high or very low compared to the rest of the data. The peak is the highest point on the graph or the data that occurs most often.